Are Week 1 Breakouts Worth Your Waiver Priority?
Every September, a player nobody expected explodes in Week 1 and fantasy managers rush to the waiver wire hoping they found the next Puka Nacua or Kyren Williams. We studied ten seasons of late-drafted Week 1 breakouts to find out how often the explosion actually became lasting fantasy value.
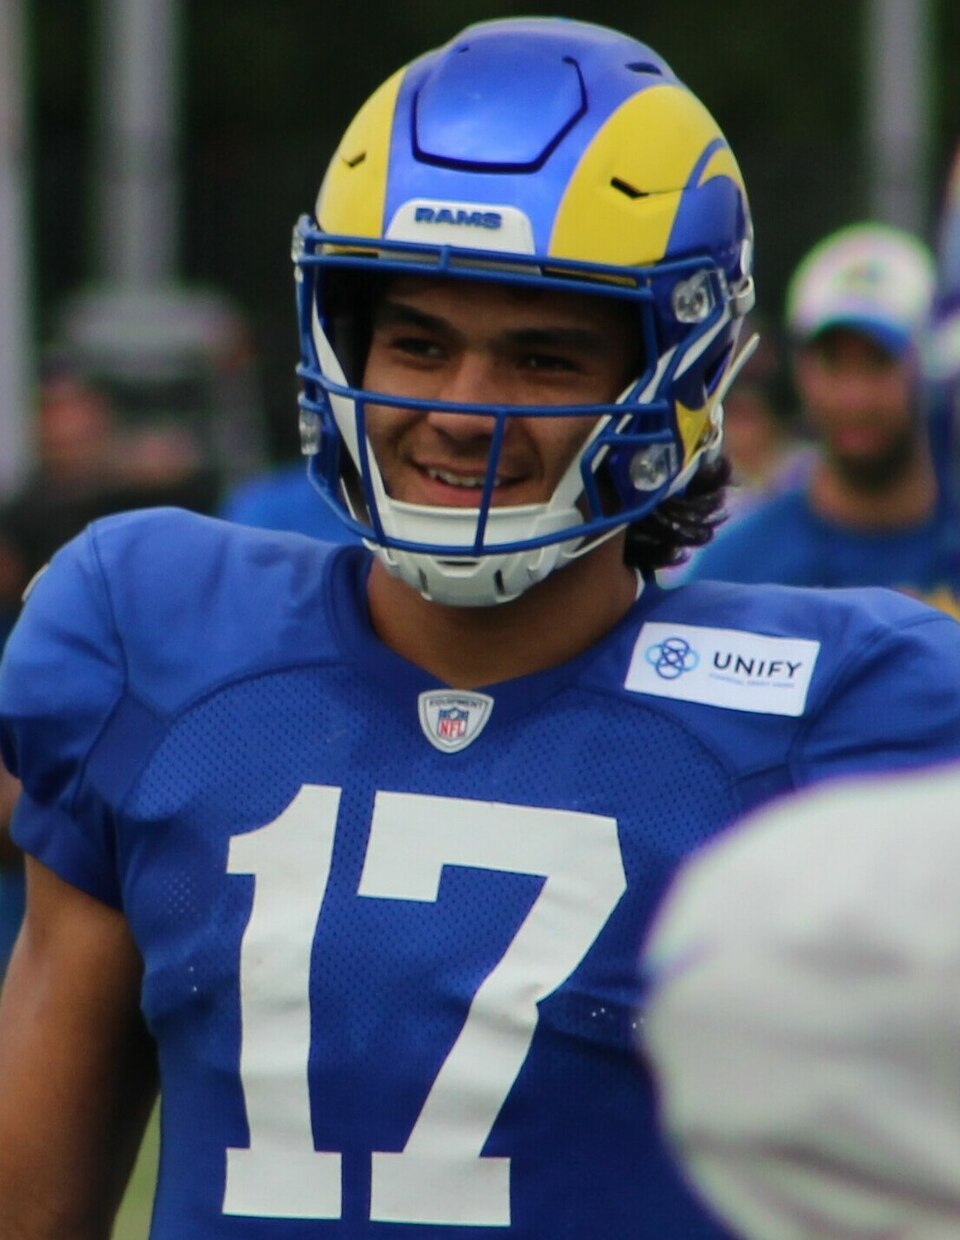
Week 1 tells you who deserves attention — not automatically who deserves your waiver priority.
Across 201 late-drafted Week 1 breakouts, only about one-third repeated the breakout immediately in Week 2. Running backs and wide receivers produced especially low season-long starter hit rates, while quarterbacks and tight ends were more likely to remain fantasy relevant.
Are you chasing a new role — or one great box score?
Week 1 is uniquely dangerous for fantasy decision-making. It is our first real data point, but it is still only one data point. A touchdown can turn five touches into a waiver frenzy. One busted coverage can make a receiver look like the breakout of the year.
At the same time, Week 1 really can reveal information that preseason drafts missed: a new starter, a larger route share, an unexpected workload or a player whose talent simply demanded a bigger role.
So instead of asking whether Week 1 breakouts are “real,” we asked a more useful question: when a player drafted outside the first 10 rounds suddenly finishes near the top of his position in Week 1, what does he become afterward?
201 late-drafted Week 1 breakouts.
The primary sample used historical 12-team PPR ADP and defined “late drafted” as ADP 120 or later. Week 1 breakout thresholds were position-specific: Top 12 at QB and TE, and Top 20 at RB and WR.
The regression is immediate. Across all four positions, average scoring fell from 19.51 points in Week 1 to 12.03 in Week 2. Yet the performances were not pure noise: 84.6% eventually produced at least one more breakout-level week, and 52.2% produced three or more.
QB breakouts carry real signal — but replacement value matters.
We found 45 quarterbacks with ADP 120+ who finished Week 1 inside the Top 12. More than 91% eventually produced another Top-12 week, and 62.2% produced at least three additional Top-12 weeks.
That means 26.7% became season-long Top-12 quarterbacks. The hit rate is meaningful. The strategic question is whether that is worth premium waiver capital in a one-QB league, where replacement options are usually easier to find than at RB or WR.
| Player | Season | ADP | Week 1 | W2–17 PPG | ROS Tier |
|---|---|---|---|---|---|
| Patrick Mahomes | 2018 | 122.21 | 28.34 | 25.92 | QB1 |
| Matt Ryan | 2016 | 150.37 | 24.36 | 21.54 | QB2 |
| Baker Mayfield | 2024 | 139.35 | 29.66 | 20.97 | QB5 |
| Alex Smith | 2017 | 181.36 | 31.02 | 18.87 | QB5 |
| Carson Wentz | 2017 | 132.36 | 18.88 | 21.90 | QB6 |
A late QB who shows a real role and Top-12 ceiling deserves attention, but a one-QB manager should still compare the upgrade with what is freely available at the position.
The hit rate is low. The jackpot can win your league.
Running back is where waiver priority becomes psychologically difficult. Only 9 of 39 late-drafted Week 1 breakout RBs became an RB2 or better over the rest of the season — a 23.1% hit rate. More than 61% finished outside the Top 36.
The reason managers keep taking the risk is obvious when you look at the winners. The sample includes exactly the kind of waiver claims that can reshape a season.
| Player | Season | ADP | Week 1 | W2–17 PPG | ROS Tier |
|---|---|---|---|---|---|
| Kyren Williams | 2023 | 178.97 | 17.40 | 21.60 | RB6 |
| James Conner | 2018 | 169.35 | 34.20 | 20.48 | RB8 |
| Phillip Lindsay | 2018 | 231.39 | 18.20 | 14.61 | RB13 |
Week 1 workload helped modestly. Higher-usage RB breakouts averaged 9.50 PPR points the rest of the season versus 8.93 for the lower-usage half, and 95% of the higher-usage group eventually produced another breakout week.
At RB, chase a workload change — not a touchdown. The base rate is poor, but the rare hits are valuable enough to justify aggression when Week 1 reveals a real path to touches.
The Puka problem.
Wide receiver produced the most sobering result in the study. We found 62 late-drafted WRs who finished Week 1 inside the Top 20. Only seven became Top-24 receivers over the remainder of the season.
Only one late-drafted Week 1 breakout in the entire WR sample became a rest-of-season WR1.
| Player | Season | ADP | Week 1 | Week 2 | W2–17 PPG | ROS Tier |
|---|---|---|---|---|---|---|
| Puka Nacua | 2023 | 152.43 | 21.90 | 30.10 | 17.50 | WR7 |
Perhaps most surprisingly, Week 1 opportunity alone did not rescue the WR signal. The higher-usage half averaged 9.26 PPR points from Weeks 2–17; the lower-usage half averaged 9.38.
Be skeptical of a one-week WR explosion. The upside can be enormous, but the historical Top-24 hit rate was only 11.3%. Look for a genuine role change, not simply a long touchdown or one unusually efficient afternoon.
The position where reacting quickly may make the most sense.
Tight end held up even after we switched from the misleading “Top 24” measure to fantasy-relevant tiers. Of 55 late-drafted Week 1 Top-12 TEs, 30.9% finished the rest of the season as a Top-12 TE by total points.
The PPG version tells essentially the same story: 32.7% of qualifying TEs with at least six later games ranked inside the Top 12 in rest-of-season PPG.
Unlike WR, Week 1 opportunity also provided a useful clue. The higher-usage half of TE breakouts averaged 9.19 PPG from Weeks 2–17 compared with 7.12 for the lower-usage group.
| Player | Season | ADP | Week 1 | W2–17 PPG | ROS Tier |
|---|---|---|---|---|---|
| Sam LaPorta | 2023 | 125.67 | 8.90 | 14.43 | TE2 |
| George Kittle | 2018 | 136.91 | 14.00 | 16.31 | TE3 |
| Darren Waller | 2019 | 157.97 | 14.00 | 13.80 | TE3 |
| Eric Ebron | 2018 | 160.41 | 15.10 | 13.81 | TE4 |
| Mark Andrews | 2019 | 141.79 | 24.80 | 13.03 | TE5 |
Take a Week 1 TE breakout seriously when the points came with targets and routes. At a scarce one-starter position, discovering a real Top-12 role can be more valuable than the raw point total suggests.
Week 1 does not erase what the market knew in August.
We repeated the study at increasingly deeper ADP cutoffs. The farther down the preseason draft board a breakout came from, the weaker the average rest-of-season result became.
| Preseason ADP Cutoff | Breakouts | W2–17 PPG | 3+ More Breakout Weeks | Median Repeat Breakout Weeks |
|---|---|---|---|---|
| 100+ | 240 | 10.58 | 55.0% | 3 |
| 120+ | 201 | 10.27 | 52.2% | 3 |
| 144+ | 141 | 9.43 | 44.7% | 2 |
| 168+ | 85 | 8.87 | 41.2% | 2 |
In other words, a player drafted 125th who breaks out in Week 1 should not automatically be evaluated the same way as a player drafted 220th. The Week 1 result matters — but so does the prior information that shaped the draft market.
What should you actually do on Tuesday morning?
| Position | How Aggressively to React | What to Look For |
|---|---|---|
| QB | Moderate | Top-12 ceiling is meaningful, but compare the upgrade with readily available one-QB replacements. |
| RB | Aggressive when role changes | Carries, targets, red-zone work, injury-created opportunity and a clear path to sustained touches. |
| WR | Cautious | Routes, targets and depth-chart movement. Do not chase one long touchdown or unsustainable efficiency. |
| TE | Aggressive when targets are real | Targets/routes and an every-down role. Week 1 TE usage was more informative than the raw score alone. |
Don't chase the fantasy points. Chase the reason the fantasy points happened.
Week 1 is valuable information, but the scoreboard is only the beginning. The best waiver claims are the players whose role changed in a way that can survive after the opening-week touchdowns and big plays disappear.
How we tested it.
The study covered the 2016–2025 regular seasons using nflverse weekly player statistics and historical MyFantasyLeague PPR ADP. The primary cohort required an observed preseason ADP of 120 or later in the historical MFL pool.
A Week 1 breakout was defined as a Top-12 positional finish for QB or TE, or a Top-20 finish for RB or WR. The primary sample contained 201 breakouts: 45 QB, 39 RB, 62 WR and 55 TE.
Each player was then tracked in Week 2, Weeks 2–8, Weeks 9–17 and Weeks 2–17. Rest-of-season fantasy tiers were calculated by total PPR points, with a second check based on PPR points per game for players who appeared in at least six games after Week 1.
ADP audit: Expanding the MFL historical ADP pool to players appearing in at least one qualifying draft matched 626 of 642 Week 1 positional qualifiers. Two source-position mismatches were excluded from the audit, and 14 genuinely untracked players were evaluated separately as a sensitivity check rather than assigned invented exact ADPs.
Sensitivity check: Including the 14 MFL-untracked players produced 215 breakouts and did not materially change the headline conclusion. Average Weeks 2–17 scoring moved from 10.27 to 9.96 PPR points per game.
Interpretation: This is a historical descriptive study, not a guarantee that any individual Week 1 breakout will succeed or fail. Injury, role, depth-chart context and team changes still matter.