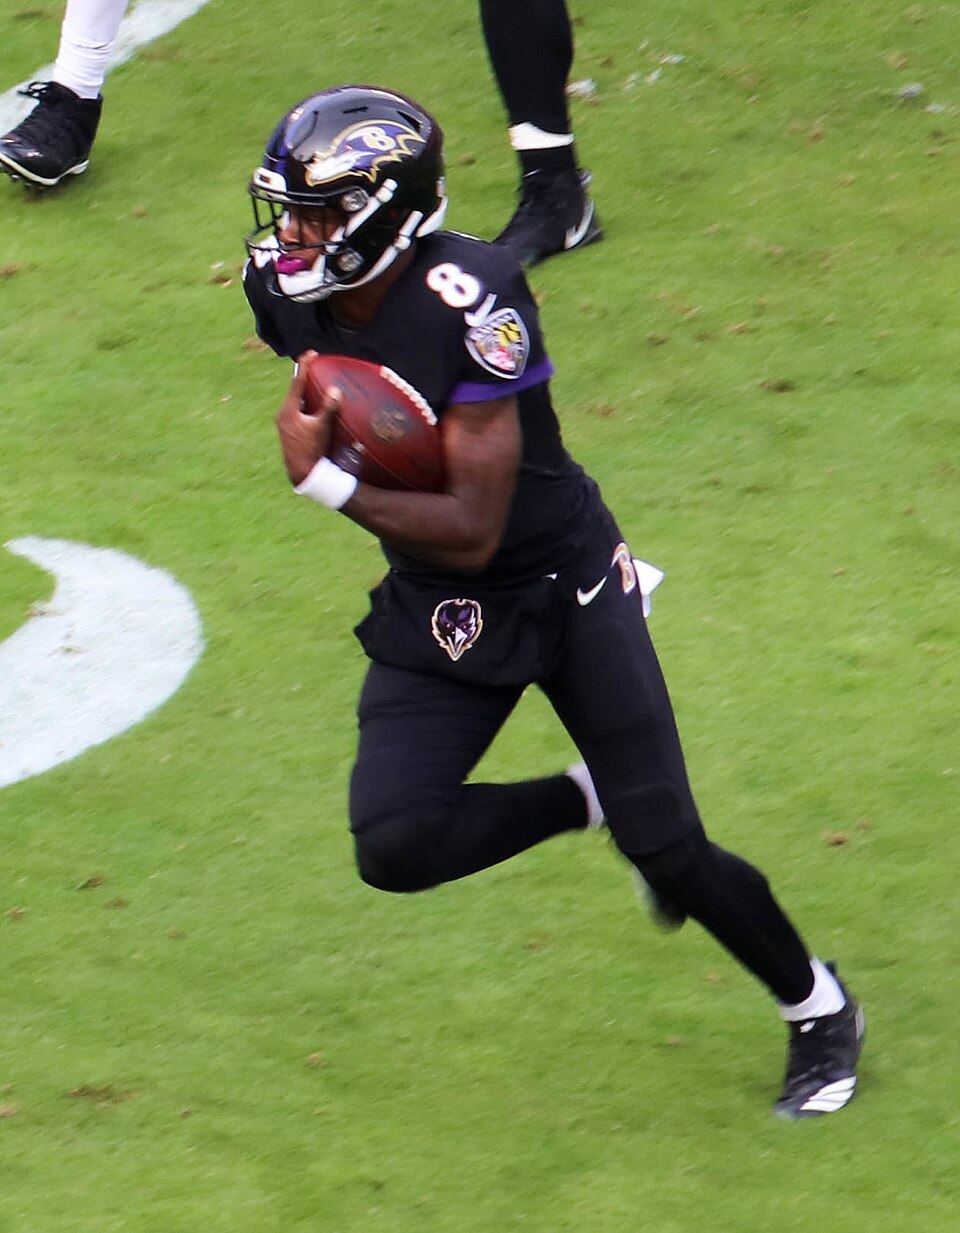
The idea sounds simple: if the quarterback runs, the running back must lose fantasy value. Quarterback scrambles can replace checkdowns. Designed quarterback runs can replace handoffs. Goal-line quarterback carries can replace running-back touchdowns.
But those effects do not all move in the same direction. Mobile quarterbacks can also stress the defense horizontally, hold backside defenders and create cleaner rushing lanes. So instead of asking whether rushing quarterbacks are simply “good” or “bad” for running backs, we separated the problem into fantasy production, receiving opportunity, rushing efficiency and total offensive volume.
The first result: fantasy scoring falls, but not enough to call it definitive
| Primary RB metric | Low-rush QB | High-rush QB | Difference | Welch p-value |
|---|---|---|---|---|
| Standard PPG | 11.96 | 11.26 | -5.9% | 0.303 |
| Half-PPR PPG | 13.31 | 12.35 | -7.2% | 0.190 |
| PPR PPG | 14.66 | 13.45 | -8.2% | 0.127 |
| Carries/game | 14.32 | 13.63 | -4.9% | 0.279 |
| Targets/game | 3.50 | 2.83 | -19.2% | 0.023 |
| Receptions/game | 2.70 | 2.20 | -18.7% | 0.036 |
| Yards/carry | 4.33 | 4.61 | +6.5% | 0.023 |
Primary backs alongside high-rush quarterbacks averaged fewer fantasy points in every scoring format, and the penalty grew as receptions became more valuable. But the bucket-level fantasy scoring differences did not reach conventional statistical significance.
That matters. The data does not justify saying that a mobile quarterback automatically costs his running back 8% of his PPR production. What does hold up statistically is more specific.
The real effect is through the air
The clearest signal in the study was running-back receiving volume. Primary RB targets fell from 3.50 per game with low-rush quarterbacks to 2.83 with high-rush quarterbacks. Receptions fell from 2.70 to 2.20 per game.
Those differences were statistically significant, and the result also appeared when quarterback rushing was treated as a continuous variable instead of forcing players into arbitrary buckets. As QB rushing attempts increased, RB targets and receptions declined.
Every additional QB rush attempt per game was associated with about 0.13 fewer primary-RB targets per game. The relationship was statistically significant (p = 0.002).
That does not prove every quarterback scramble literally replaces a checkdown. But the football mechanism is plausible: a quarterback who can create with his legs has an alternative to throwing underneath when a pass play breaks down.
But are mobile-QB offenses simply running fewer plays?
That was our next question. Perhaps the receiving decline had nothing specifically to do with running backs. Maybe rushing-heavy offenses simply burn more clock and create fewer total offensive snaps.
The data did not support that explanation.
| Team metric | Low-rush QB | High-rush QB | Difference | Welch p-value |
|---|---|---|---|---|
| Offensive plays/game | 63.18 | 63.97 | +1.3% | 0.102 |
| Pass attempts/game | 35.11 | 31.43 | -10.5% | <0.00001 |
| Rush attempts/game | 25.79 | 30.17 | +17.0% | <0.00001 |
| Primary RB targets/game | 3.50 | 2.83 | -19.2% | 0.023 |
| RB target % of pass attempts | 8.96% | 8.05% | -10.2% | 0.278 |
High-rush-QB teams actually averaged slightly more offensive plays, not fewer. The difference was not statistically significant, but it is enough to reject the idea that fewer total snaps are driving the result.
What changes is the composition of those plays. High-rush-QB offenses averaged 3.68 fewer pass attempts per game and 4.38 more rush attempts per game. Both differences were highly significant.
Running-QB offenses do not meaningfully shrink the number of offensive plays. They shift those plays from passes toward runs.
That distinction matters because it explains most of the RB target decline without requiring a stronger claim that mobile quarterbacks specifically “refuse” to target running backs.
The primary RB's target share of team pass attempts was also lower — 8.05% versus 8.96% — but that difference was not statistically significant. So the strongest evidence is that the overall passing pool becomes smaller, not that the running back is necessarily being singled out for fewer targets within that pool.
The surprising upside: rushing efficiency improves
If mobile quarterbacks reduce receiving volume, why doesn't RB fantasy production fall more dramatically?
One answer may be rushing efficiency. Primary RBs alongside high-rush quarterbacks averaged 4.61 yards per carry compared with 4.33 alongside low-rush quarterbacks — a 6.5% increase that was statistically significant.
Again, this is observational data, so it should not be read as proof that the quarterback alone caused the efficiency gain. But the result fits the football logic. Defenses facing a real quarterback-run threat have another gap and another ballcarrier to account for, which can create cleaner opportunities for the running back.
Elite RB seasons still happen next to running QBs
The high-rush-QB sample includes plenty of examples that make a blanket fade impossible to defend: Saquon Barkley with Jalen Hurts, Derrick Henry with Lamar Jackson, Christian McCaffrey with Cam Newton, Jonathan Taylor with Anthony Richardson, James Cook with Josh Allen and LeSean McCoy with Tyrod Taylor.
The existence of those seasons is important context. A mobile quarterback can change the shape of a running back's fantasy profile without destroying the profile itself.
What this means for fantasy drafts
The practical takeaway is not “avoid RBs with mobile QBs.” The data is too nuanced for that.
Instead, the quarterback's rushing profile should affect how you value the running back. Receiving-dependent backs deserve a little more scrutiny in PPR formats because the passing pool tends to shrink. Backs whose value comes primarily from carries, rushing efficiency and touchdowns may be much less vulnerable — and could even benefit from the spacing advantages created by a mobile quarterback.
The bottom line
The myth says running quarterbacks kill running-back fantasy value. The evidence says something narrower: mobile quarterbacks change where the running back's fantasy production comes from.
Primary backs in high-rush-QB offenses saw significantly fewer targets and receptions, while averaging significantly more yards per carry. Those offenses did not run fewer total plays — they simply replaced some passing volume with rushing volume.
For fantasy managers, that makes this less of a universal downgrade and more of a scoring-format and player-profile question.
How we tested the myth
- Regular seasons from 2016–2025.
- 282 qualifying primary QB/RB team-seasons.
- Primary QBs were identified by team pass-attempt volume and required at least eight games.
- Primary RBs were identified using carries + targets and required at least eight games.
- QB rushing tiers: Low Rush (<3 carries/game), Moderate Rush (3 to <6), High Rush (6+).
- We repeated the analysis using QB rushing yards per game as an alternative classification; the broad pattern remained similar.
- Statistical checks included Welch's t-tests, Mann-Whitney U tests, Pearson/Spearman correlations and simple linear regression.
- Team offensive plays were approximated as pass attempts + rush attempts + sacks from weekly player statistics.
This is an observational historical study. Statistical relationships do not by themselves establish causation, and individual player/team contexts can differ materially from historical averages.