6 Running Backs Changed Teams. Did Their Fantasy Value Actually Improve?
A better offense doesn't automatically mean a better fantasy situation. We dug into 2025 play-by-play data to measure how the scoring environment changes for six notable running backs playing for new teams in 2026.
| Player | Move | Fantasy Value | Primary Reason |
|---|---|---|---|
| Kenneth Walker III | SEA → KC | → MIXED | Smaller RB pie, potentially greater personal share |
| Travis Etienne | JAX → NO | ↓ DOWN | Major decline in scoring-zone RB volume |
| David Montgomery | DET → HOU | ↓ DOWN | Leaves an elite high-value-touch environment |
| Rico Dowdle | CAR → PIT | ↑ UP | Much larger inside-10 and inside-5 opportunity pool |
| Tyler Allgeier | ATL → ARI | ↓ DOWN | Fewer RB scoring opportunities at every level |
| Brian Robinson Jr. | SF → ATL | → MIXED | Team environment declines, personal role could improve |
Kenneth Walker III
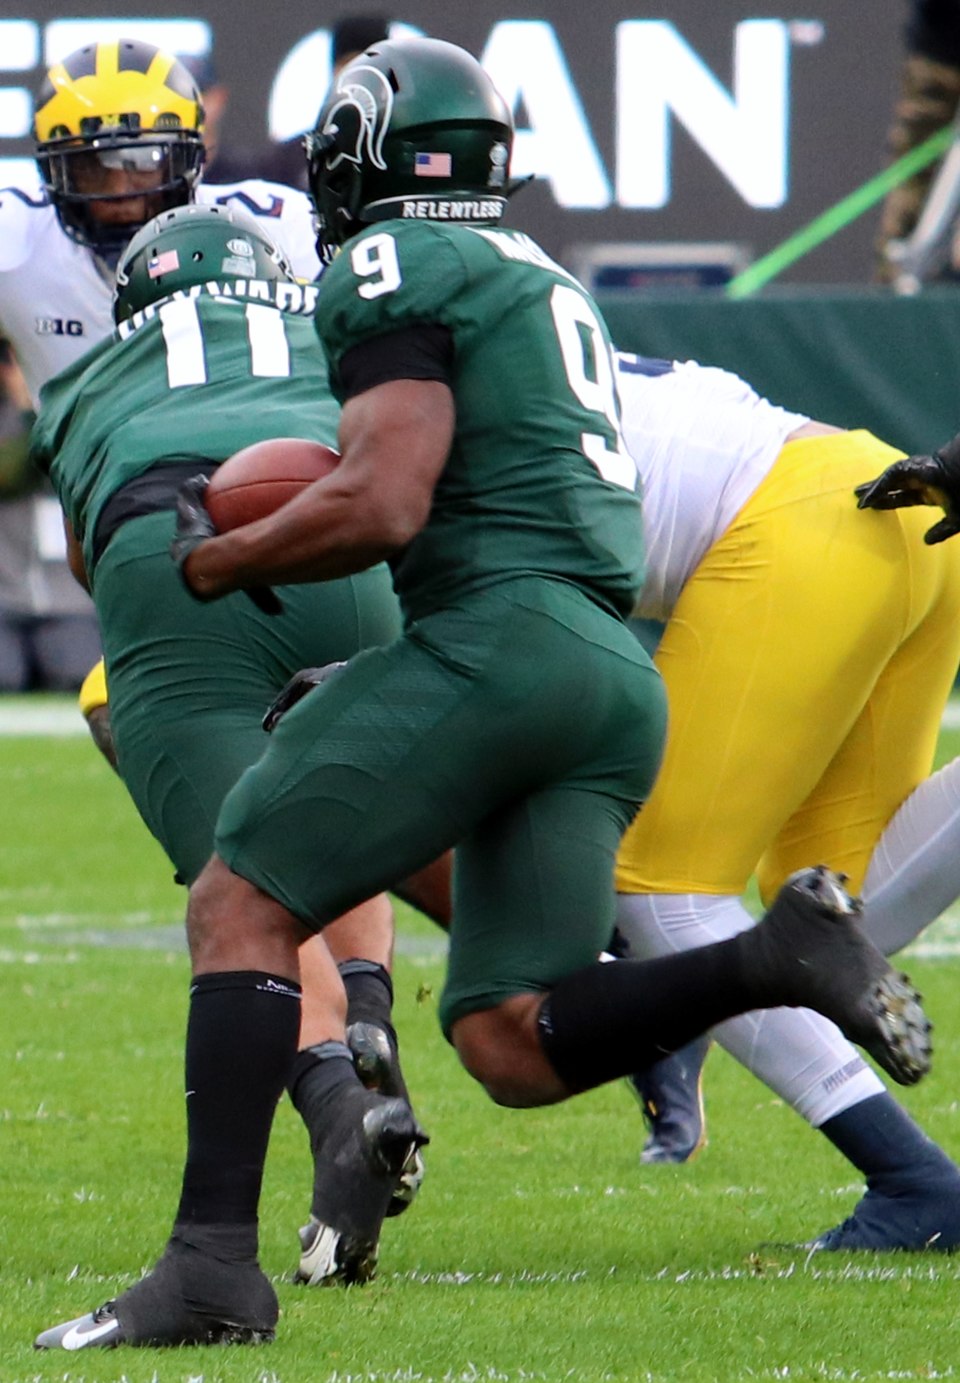
At the team level, Walker is not moving into a better rushing environment. Seattle generated more running-back carries per game in the red zone, inside the 10 and inside the 5 than Kansas City did in 2025.
That makes the move look like a downgrade until we examine how those opportunities were distributed.
Kansas City actually generated more total offensive plays inside the five than Seattle — 3.00 per game versus 2.65 — but fewer of those plays became RB carries. When the Chiefs did call an RB run, however, the goal-line work was extraordinarily concentrated.
Walker also enters Kansas City after rushing for 1,027 yards on 221 carries in 2025, an average of 4.65 yards per attempt.
Travis Etienne
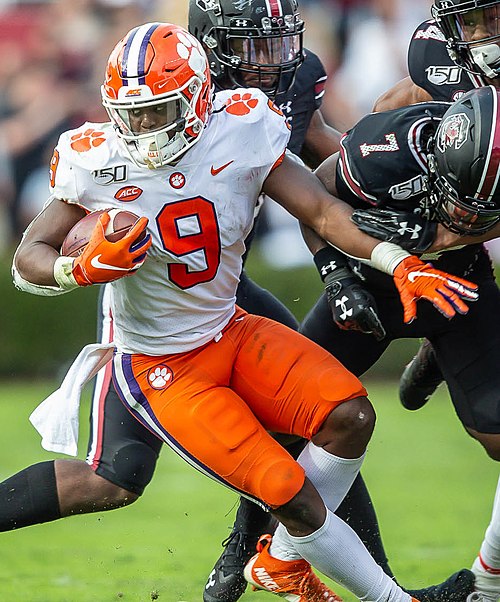
Etienne's move produces the clearest warning in this group. Jacksonville generated 5.18 red-zone RB carries per game in 2025. New Orleans generated only 2.06.
The gap becomes even more concerning near the goal line. Jacksonville produced 2.24 RB carries per game inside the 10 and 1.24 inside the five. New Orleans managed only 0.88 and 0.41.
This wasn't simply a difference in rushing percentage. Jacksonville generated substantially more offensive volume in scoring territory, meaning Etienne is moving from a larger fantasy-opportunity pie to a considerably smaller one.
David Montgomery
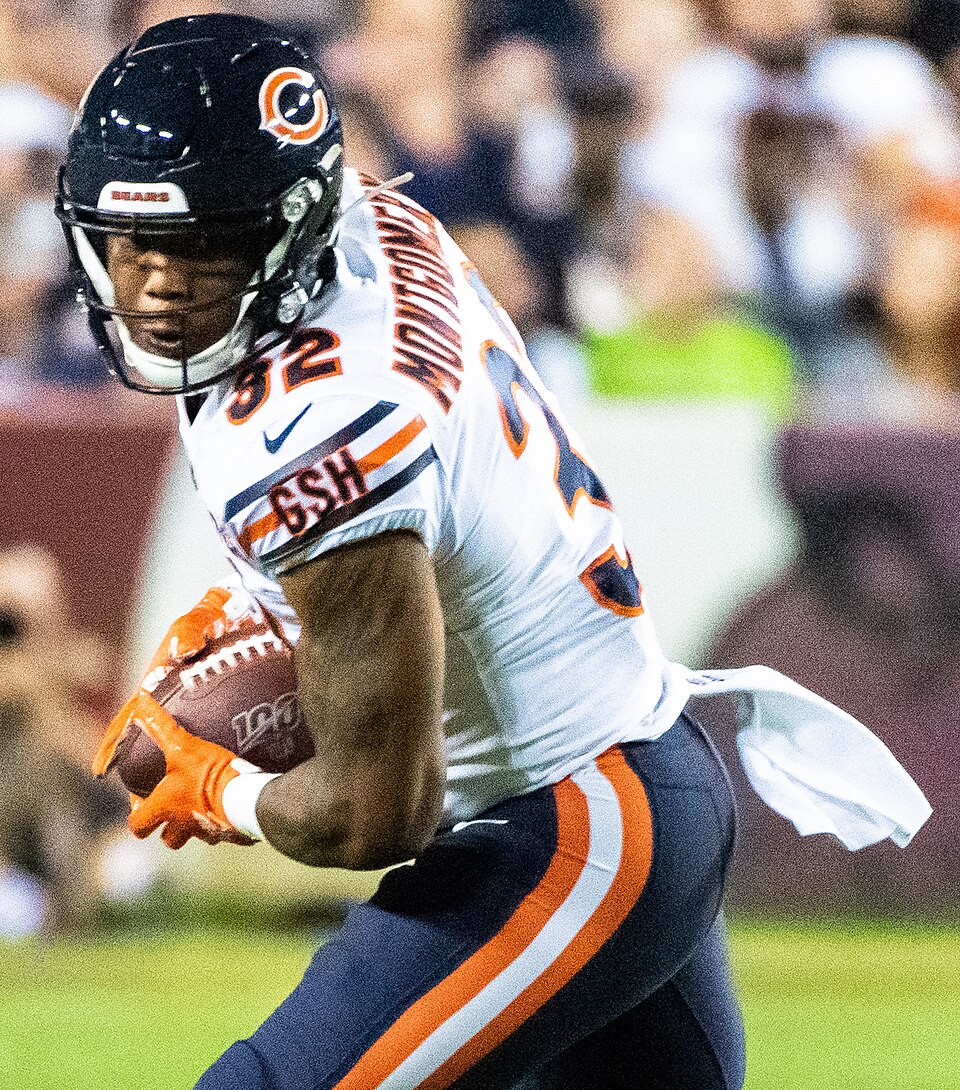
Montgomery's Detroit role was valuable because the Lions consistently created high-value rushing opportunities. In 2025, Detroit generated 5.24 RB carries per game in the red zone and 2.82 inside the 10.
Houston's corresponding numbers were 3.94 and 1.82. The gap inside the five was smaller, but still favored Detroit: 1.59 RB carries per game compared with Houston's 1.24.
That's an important number because Montgomery's fantasy appeal has been closely tied to valuable short-yardage touches. Houston can still make the move work if it concentrates those opportunities into Montgomery, but the underlying team environment gives him less margin for error.
Rico Dowdle
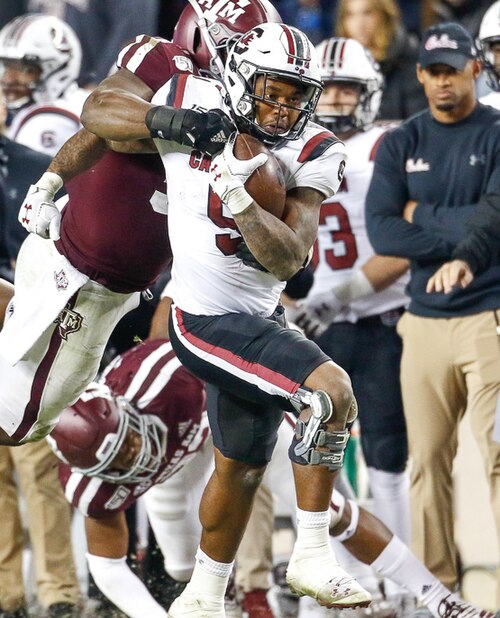
Unlike several players in this study, Dowdle doesn't need a complicated explanation for why his new scoring environment looks better. Pittsburgh generated more RB opportunities at every scoring-zone level.
The biggest difference came where fantasy touches are most valuable. Carolina produced just 0.71 RB carries per game inside the five. Pittsburgh produced 1.35 — nearly twice as many.
Dowdle is also coming off a 2025 season with 1,076 rushing yards and 297 receiving yards, so this isn't simply a marginal player entering a better situation. The underlying production was already there.
The caveat is workload. A larger opportunity pool only matters if Dowdle captures enough of it, and Pittsburgh's backfield still creates committee risk.
Tyler Allgeier
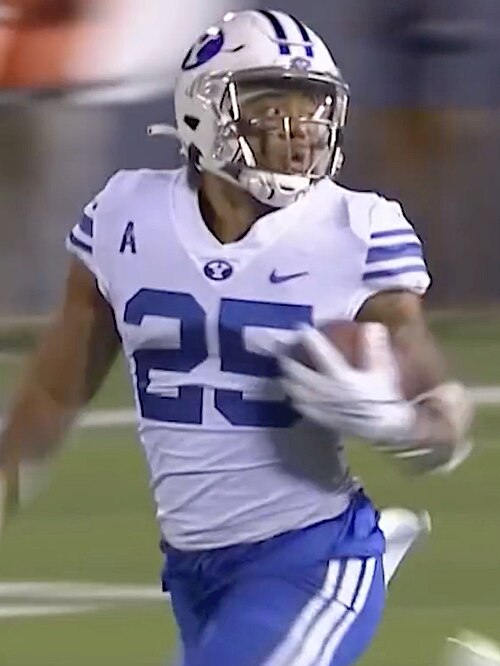
Allgeier's move is interesting because Arizona's problem wasn't simply an inability to reach scoring territory. The Cardinals reached the red zone often enough to create opportunities, but those possessions did not translate into RB rushing volume at Atlanta's rate.
Atlanta produced 4.00 RB red-zone carries per game in 2025. Arizona produced only 2.76. The Falcons also held advantages inside the 10 and inside the five.
Allgeier enters the move after rushing 143 times for 514 yards and eight touchdowns in 2025 — 3.59 yards per carry. That efficiency already gives him less room for his opportunity environment to deteriorate.
Brian Robinson Jr.
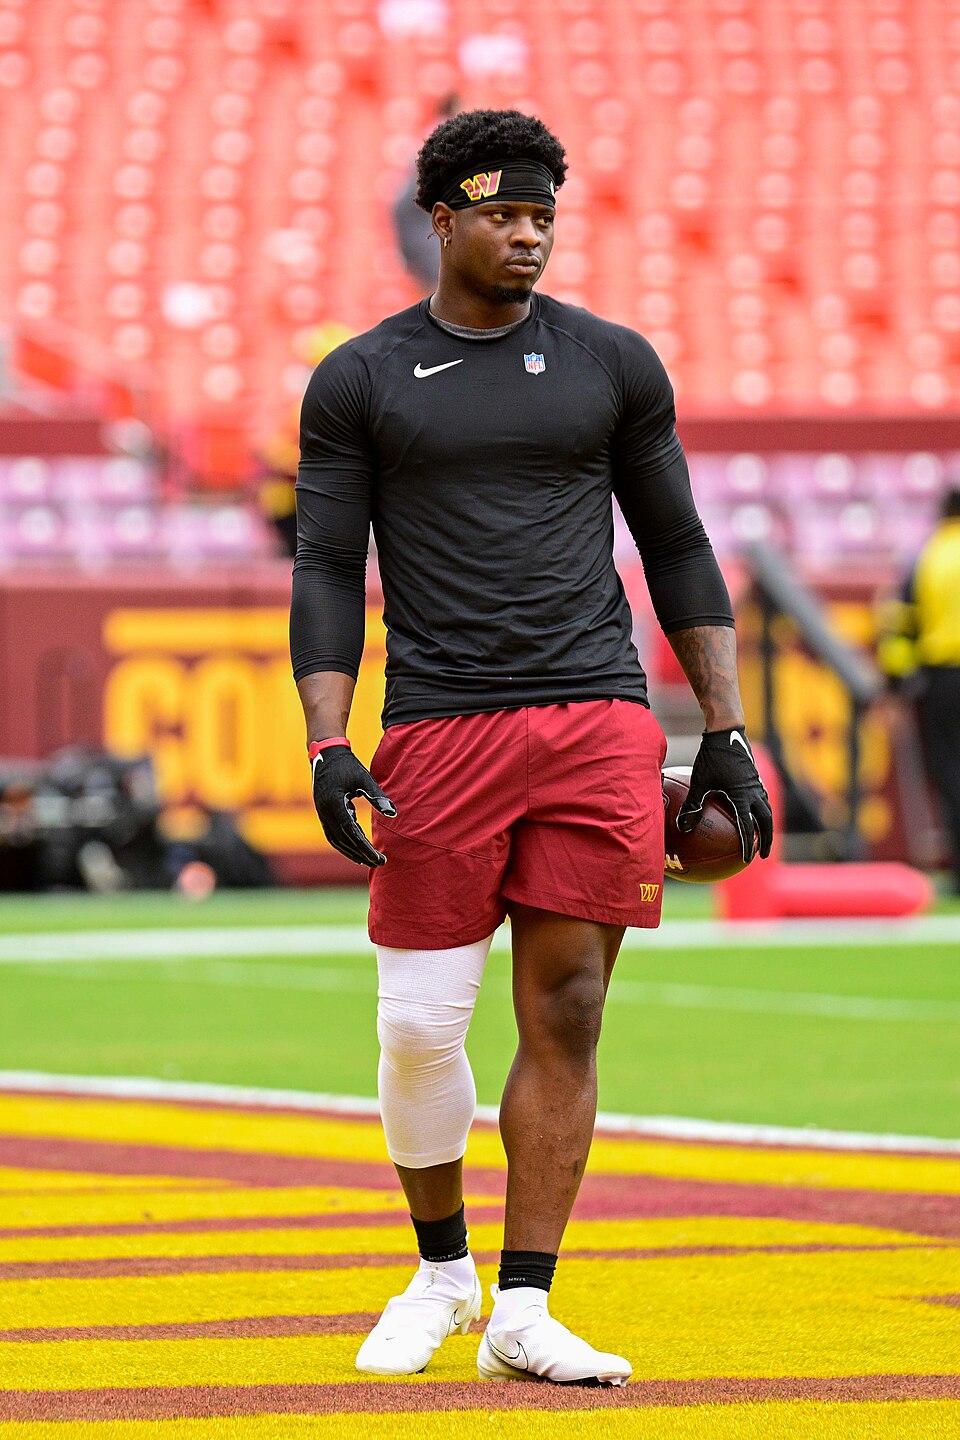
This is the player who best demonstrates why team statistics cannot be used without individual context.
San Francisco generated more RB opportunities than Atlanta in every scoring zone we measured. If Robinson were San Francisco's lead back, moving to Atlanta would look like a straightforward downgrade.
But Robinson wasn't San Francisco's lead back.
That's why comparing San Francisco's historical RB1 workload directly with Atlanta's historical RB1 would be misleading. Robinson's fantasy value depends on how much his personal share increases, not on whether Atlanta can reproduce Christian McCaffrey's workload.
The biggest lesson: opportunity share isn't enough.
When a running back changes teams, it's tempting to look at the new offense and immediately label the move an upgrade or downgrade. The numbers show why that can be misleading.
The first question is how large the scoring-opportunity pie actually is. How often does the offense reach scoring territory? How many plays does it generate there? And how many of those opportunities actually become running-back carries?
Only then should we ask how much of that pie the player is likely to capture.
Rico Dowdle's move to Pittsburgh produced the clearest improvement in underlying RB scoring environment. Pittsburgh generated nearly twice as many inside-the-five RB carries per game as Carolina did in 2025.
Travis Etienne moves in the opposite direction. New Orleans produced dramatically fewer RB opportunities throughout scoring territory than Jacksonville.
Kenneth Walker and Brian Robinson are more complicated. Their team-level environments don't necessarily improve, but their individual roles could. Those are exactly the situations where looking only at team rushing percentages — or only at a depth chart — can miss the bigger fantasy picture.
As 2026 roles become clearer, that's what we'll be watching: how big is the pie, and how much of it does each back actually get?